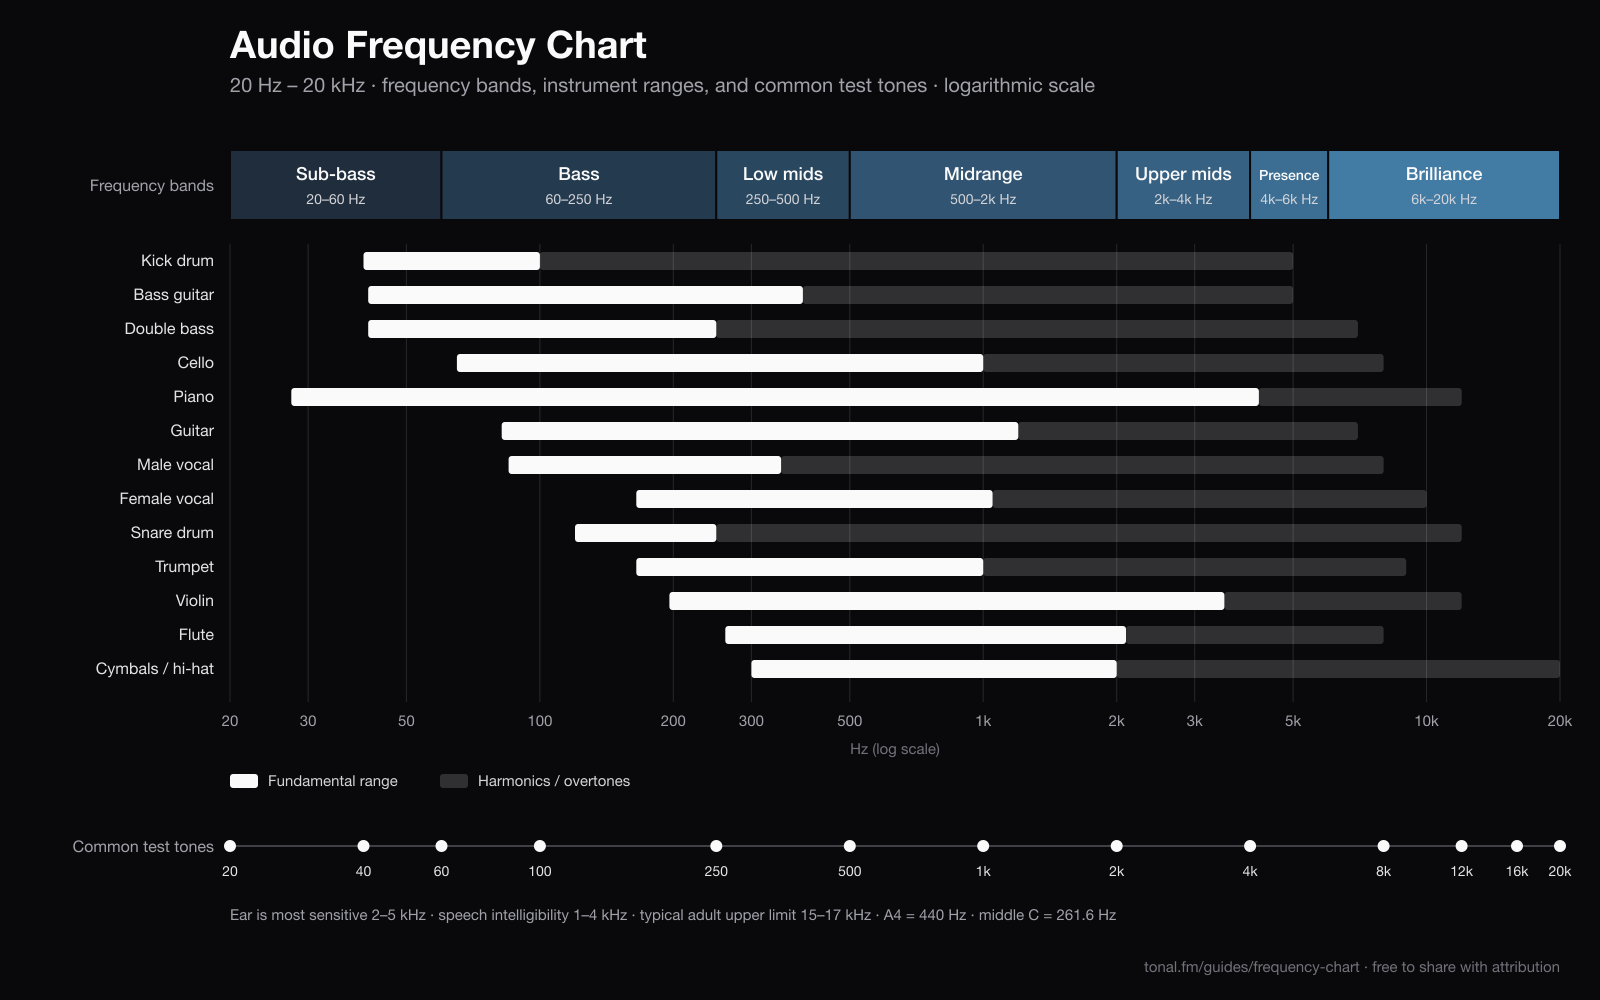
The seven frequency bands
These are the divisions most mixing engineers and EQ charts use. The boundaries are conventions - you will see them shifted by up to an octave elsewhere - but the character of each region is consistent. Click a band to hear a tone from it.
| Band | Range | What lives here | Too much | Too little |
|---|---|---|---|---|
| Sub-bass | 20 – 60 Hz | Felt more than heard. Rumble, weight, the bottom of a kick drum and an 808. | Muddy, boomy, eats headroom | Thin, no physical impact |
| Bass | 60 – 250 Hz | The fundamental of bass guitar, kick and the low end of most instruments. Where groove lives. | Boomy, bloated | Weak, lacks foundation |
| Low mids | 250 – 500 Hz | Body and warmth of guitars, piano, vocals. The region most likely to build up in a mix. | Muddy, boxy, congested | Hollow, thin |
| Midrange | 500 Hz – 2 kHz | Where the ear resolves most detail. The core of vocals and nearly every melodic instrument. | Honky, nasal, telephone-like | Distant, lacks presence |
| Upper mids | 2 – 4 kHz | Consonants and attack. The ear is most sensitive here, so small changes are very audible. | Harsh, fatiguing, piercing | Dull, words hard to make out |
| Presence | 4 – 6 kHz | Clarity and closeness. Boosts bring a vocal or snare to the front of the mix. | Sibilant, sharp | Veiled, far away |
| Brilliance | 6 – 20 kHz | Air, sparkle, cymbal shimmer. Mostly harmonics; almost no fundamentals live here. | Brittle, hissy | Dull, lifeless, "closed" |
Instrument frequency ranges
The fundamental range is the lowest to highest note the instrument plays. Harmonics are the overtones above that which give each instrument its character - and they are what you lose when a speaker or a compressed file rolls off the top end.
| Instrument | Fundamentals | Harmonics | Notes |
|---|---|---|---|
| Kick drum | 40 – 100 Hz | up to 5 kHz (beater click 2 – 5 kHz) | Fundamental 50 – 60 Hz on most kits; the "click" is what cuts through on small speakers. |
| Bass guitar (4-string) | 41 – 392 Hz | up to 5 kHz | Low E = 41 Hz. Most of what you hear as "bass" on earbuds is the 2nd harmonic around 80 – 120 Hz. |
| Double bass | 41 – 250 Hz | up to 7 kHz | Same low E as bass guitar; bow noise and finger attack extend the top. |
| Cello | 65 – 1,000 Hz | up to 8 kHz | Low C = 65 Hz. Body resonance gives warmth at 200 – 300 Hz. |
| Piano | 27.5 Hz – 4.2 kHz | up to 12 kHz | A0 to C8 - the widest fundamental range of any common instrument. See the note table below. |
| Guitar (standard tuning) | 82 – 1,200 Hz | up to 7 kHz | Low E = 82 Hz; 24th fret on the high E ≈ 1.3 kHz. Pick attack lives at 2 – 5 kHz. |
| Male vocal | 85 – 350 Hz | up to 8 kHz | Speaking fundamental ~100 – 150 Hz; sibilance 5 – 8 kHz; intelligibility 1 – 4 kHz. |
| Female vocal | 165 – 1,050 Hz | up to 10 kHz | Speaking fundamental ~180 – 250 Hz; soprano top near C6 (1,047 Hz). |
| Snare drum | 120 – 250 Hz | up to 12 kHz | Shell tone around 150 – 250 Hz; wire "snap" is broadband 2 – 10 kHz. |
| Trumpet | 165 – 1,000 Hz | up to 9 kHz | Bright, harmonically dense - one of the loudest instruments in the 2 – 4 kHz band. |
| Violin | 196 – 3,500 Hz | up to 12 kHz | Low G = 196 Hz. Top of the E string reaches well into the upper mids. |
| Flute | 262 Hz – 2.1 kHz | up to 8 kHz | Nearly pure sine in the low register; breath noise adds air above 5 kHz. |
| Cymbals / hi-hat | 300 Hz – 2 kHz | 2 – 20 kHz | Energy is mostly above 5 kHz - the reason a high-frequency roll-off makes a mix sound "dull". |
Common test frequencies
The tones used for speaker checks, hearing screening and level calibration. Each links to a page where you can play it and download it as a WAV.
| Frequency | Used for |
|---|---|
| 20 Hz | Lower limit of hearing; subwoofer extension test |
| 40 Hz | Subwoofer / sub-bass check; gamma-wave reference |
| 60 Hz | Mains hum (60 Hz regions); bass port tuning |
| 100 Hz | Woofer check; bass guitar region |
| 250 Hz | Low-mid reference; audiogram frequency |
| 300 Hz | Voice warmth / mud region |
| 500 Hz | Midrange reference; audiogram frequency |
| 1,000 Hz (1 kHz) | Universal 1 kHz reference (level calibration, 0 dB alignment) |
| 2,000 Hz (2 kHz) | Speech intelligibility; two-way crossover region |
| 3,000 Hz (3 kHz) | Peak ear sensitivity |
| 4,000 Hz (4 kHz) | Noise-induced hearing-loss notch frequency |
| 8,000 Hz (8 kHz) | Brilliance / sibilance; highest standard audiogram frequency |
| 10,000 Hz (10 kHz) | Tweeter check; "air" region |
| 12,000 Hz (12 kHz) | Age-related hearing check |
| 15,000 Hz (15 kHz) | Typical adult upper limit |
| 17,000 Hz (17 kHz) | Teen-range hearing limit ("mosquito tone") |
| 20,000 Hz (20 kHz) | Nominal upper limit of human hearing |
Need all of them at once? The test tone pack has every standard frequency as a download, and the sweep generator plays the whole range continuously.
Musical note frequencies (A4 = 440 Hz)
Equal temperament: each semitone multiplies frequency by 21/12 (≈ 1.0595), each octave doubles it. Octave 4 below, with A and C anchors for the rest of the piano; all 88 notes have their own page.
How hearing maps onto the chart
Sensitivity is not flat. The ear canal resonates around 2 – 5 kHz, boosting that region by 10 – 15 dB before sound reaches the eardrum. A 3 kHz tone sounds dramatically louder than a 50 Hz tone at the same measured level - which is why bass needs so much more power, and why harshness in the upper mids is so fatiguing.
The top end goes first. Most adults hear to 15 – 17 kHz; the ceiling drops about 1 kHz per decade after 30. Loud-noise damage shows up earlier as a notch around 4 kHz. Find your own ceiling with the hearing test or the quick hearing age test.
Speech needs surprisingly little. Intelligibility is carried by 1 – 4 kHz; a phone line passing only 300 – 3,400 Hz is perfectly understandable. That is also why hearing loss at 2 – 4 kHz produces the classic "I can hear you but can't make out the words" complaint.
Frequency chart FAQ
What are the audio frequency ranges?
Audio is usually divided into seven bands across the 20 Hz – 20 kHz hearing range: sub-bass (20 – 60 Hz), bass (60 – 250 Hz), low mids (250 – 500 Hz), midrange (500 Hz – 2 kHz), upper mids (2 – 4 kHz), presence (4 – 6 kHz) and brilliance (6 – 20 kHz). The boundaries are conventions, not hard lines - different engineers shift them by up to an octave.
What frequency range can humans hear?
Nominally 20 Hz to 20,000 Hz. Children often hear slightly above 20 kHz; most adults top out between 15 and 17 kHz, and the ceiling drops roughly 1 kHz per decade after age 30. Sensitivity is not flat: the ear is most sensitive between 2 and 5 kHz and needs far more energy to hear a 30 Hz tone than a 3 kHz one at the same perceived loudness.
What frequency is the human voice?
The fundamental of adult speech sits around 85 – 180 Hz for men and 165 – 255 Hz for women, but the information that makes words intelligible - consonants - lives at 1 – 4 kHz, and sibilance ("s" and "sh") at 5 – 8 kHz. Telephones historically passed only 300 – 3,400 Hz, which is why voices sound thin but remain understandable.
What frequency is middle C and A440?
Middle C (C4) is 261.63 Hz and the A above it (A4) is 440 Hz under the ISO 16 concert-pitch standard. Each octave doubles the frequency: A3 = 220 Hz, A5 = 880 Hz. Every note from A0 (27.5 Hz) to C8 (4,186 Hz) has its own page on tonal.fm where you can hear it.
Why is the chart on a logarithmic scale?
Because pitch perception is logarithmic: the jump from 100 to 200 Hz sounds the same size as the jump from 1,000 to 2,000 Hz (one octave each). On a linear scale the entire bass range would be squeezed into a sliver while 10 – 20 kHz - a single octave with almost no musical fundamentals - would take up half the chart.
Can I use or print this frequency chart?
Yes. The chart is free to download as PNG or SVG and to print, share, or embed in lessons and articles with a link back to this page as attribution.